Scatterplots
We often hear in the media that one type of food is good for you and another food isn't. Television advertisements warn us that staying in the sun too long may cause skin cancer. The government tells us that carbon emissions may increase global temperatures. Have you ever wondered how scientists use statistics to make conclusions like this? Here, we will investigate one of the methods used.
How to Find the Regression Equation
A Scatterplot is a graphical method used by statisticians to determine if there is a relationship between two variables (e.g. longer exposure to sunlight and increased incidence of skin cancer). The scatterplot consists of a collection of plotted points on a Cartesian plane where the independent variable is marked on the x-axis and the dependent variable is on the y-axis). If the points appear to exactly or approximately make a line, then a relationship exists. Such a relationship is called a Correlation.
The purpose of this method is to determine if a relationship exists and if so, to predict future events. For example, if there is a causative relationship between carbon emissions and global temperatures, then scientists can predict what future global temperatures may be.
The Line of Best Fit is the line that is drawn such that approximately half of the points are on each side of that line. This is also called the Regression Line. There are two methods to draw the line of best fit:
- Eye method - This is really just guessing where the line should be drawn. The aim is to have approximately half the points on either side of the line. It is an inaccurate method.
- Two Means method - The mean point of the lower half of the data is found. Then, the mean point of the upper half of the data is found. The line of best fit is then drawn through these two plotted points. This is a better method than guessing.
The Regression Equation of the line of best fit is then calculated. The equation of a line is:
y = mx + c
where
m is the gradient
c is the y-intercept.
- Use the gradient formula and the two mean points to find the gradient.
- The y-intercept is the y-value where the line crosses the y-axis.
- Refer to the webpage called "Linear Graphs" for more examples.
Positive & Negative Correlation
A Positive Correlation occurs when both variables increase at approximately the same rate and are almost in direct proportion to each other. As the x-variable increases, the y-variable also tends to increase. Similarly, both variables may decrease at the same approximate rate. Graphs showing positive correlation have upward slopes.
Examples of positive correlation are:
- The hotter the temperature is in summer, the more electric fans will be sold.
- The further the distance driven, the more fuel your car will use.
- The more study you do for an exam, the higher the exam results will be.
A Negative Correlation occurs when the x-variable increase, the y-variable tends to decrease almost in inverse proportion to each other. Graphs showing negative correlation have downward slopes.
Examples of negative correlation are:
- The hotter the temperature is in summer, the fewer electric heaters will be sold.
- The further the distance driven, the less fuel will be in your fuel tank.
- The more money you spend, the less money will be in your bank account.
Maths Fun
Woolly Mammoths (huge prehistoric elephant-like creatures) became extinct at least 10 000 years ago, possibly due a global freeze. Many whole carcasses and their tusks remain in the frozen ground of Northern China and Russia. If future global temperatures rise, there will probably be an increase in fossil findings and more will become known of their existence. What type of correlation - positive or negative - may exist between future global temperatures and the frequency of fossilized mammoth findings?
Example One - Positive Correlation

Bronco and bull riders suffer enormous strain on their bodies as they struggle to stay on the powerful writhing animals. Common injuries include fractures, torn biceps, over-extended elbow, spinal cord damage and back injuries. Here is some fictitious data to determine if a relationship between the average age of rodeo riders and the average total number of injuries per person.
| AGE OF RODEO RIDERS (YEARS) (INDEPENDENT VARIABLE ON X-AXIS) | 15 | 20 | 22 | 23 | 25 | 27 | 30 | 32 |
| TOTAL NUMBER OF INJURIES (DEPENDENT VARIABLE ON Y-AXIS) | 10 | 11 | 12 | 12 | 13 | 13 | 14 | 15 |
Answer:
Two Means:
Mean of lower half of the data for Age = (15 + 20 + 22+ 23) ÷ 4 = 20 years
Mean of lower half of the data for Injuries = (10 + 11 + 12 + 12) ÷ 4 = 11.5 injuries
Mean Point for the lower half of the data = (20 , 11.5)
Mean of lower half of the data for Age = (25 + 27 + 30 + 32) ÷ 4 = 28.5 years
Mean of lower half of the data for Injuries = (13 + 13 + 14 + 15) ÷ 4 = 13.75 injuries
Mean Point for the lower half of the data = (28.5 , 13.75)
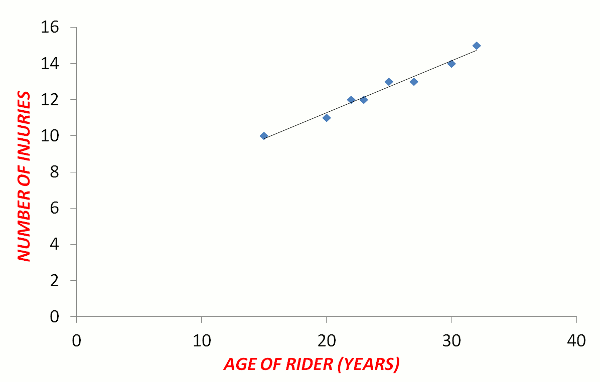
Regression Equation (in the form of y = mx + c):
Mean Point (lower half of data) = (20 , 11.5)
Mean Point (upper half of data) = (28.5 , 13.75)
| Gradient (m) = | (y2 – y1) | = | 13.75 – 11.5 | = 0.26 |
| (x2 – x1) | 28.5 – 20 |
Y-intercept (read from graph) = 6
The Regression Equation is y = 0.26x + 6
There is a positive correlation. As a rodeo rider ages, he/she will suffer more injuries.
Question - How Many Injuries are expected at 40 Years of Age?
There are 2 ways to work out how many injuries would be expected at the age of 40 years. The first way is to extend the line of best fit (extrapolate). The second way is to substitute x=40 into the regression equation. How do your answers compare?
Answer
0.26 × 40 + 6 = 16.4 injuries
Maths Fun
In 2011, Russian Customs Agents seized 5 Woolly Mammoth Tusks, over 1000 bear claws and 26 elk lips that were being smuggled in a Chinese truck. The tusks and claws were destined for sale as decorative items, but the elk lips were for an exclusive restaurant market. What type of correlation - positive or negative - may exist between government funds to prevent illegal wildlife trafficking and the profits made from smuggled goods?
Example Two - Negative Correlation

When a married couple cannot conceive a baby naturally by sexual intercourse, they may choose to use the IVF (in vitro fertilization) method. In IVF, egg cells extracted from the woman and sperm cells from the man are combined in a test-tube. However, this does not ensure a successful pregnancy and birth of a child. Here is some fictitious data to determine if a relationship between the average age of women and the percent success rate of IVF.
| AVERAGE AGE OF WOMEN (YRS) | 31 | 32 | 33 | 34 | 35 | 36 | 37 | 38 | 39 | 40 |
| PERCENT SUCCESS RATE OF IVF | 32% | 31% | 30% | 29% | 28% | 27% | 24% | 21% | 20% | 19% |
Answer:
Two Means:
Mean of lower half of the data for Age = (31 + 32 + 33 + 34 + 35) ÷ 5 = 33 years
Mean of lower half of the data for Success = (32 + 31 + 30 + 29 + 28) ÷ 5 = 30 percent
Mean Point for the lower half of the data = (33yr , 30%)
Mean of lower half of the data for Age = (36 + 37 + 38 + 39 + 40) ÷ 5 = 38 years
Mean of lower half of the data for Success = (27 + 24 + 21 + 20 + 19) ÷ 5 = 22.2 percent
Mean Point for the lower half of the data = (38yr , 22.2%)
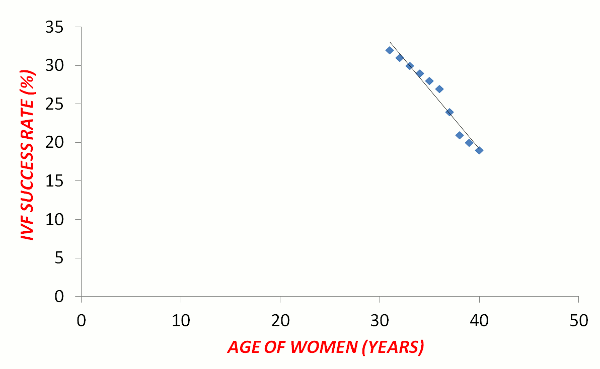
Regression Equation (in the form of y = mx + c):
Mean Point (lower half of data) = (33 , 30)
Mean Point (upper half of data) = (38 , 22.2)
| Gradient (m) = | (y2 – y1) | = | 22.2 – 30 |
| (x2 – x1) | 38 – 33 | ||
| = –1.56 (Notice that the gradient is negative.) | |||
Y-intercept (read from graph) = 34
The Regression Equation is y = –1.56x + 34
There is a negative correlation. As the women's age increases, the success rate of IVF decreases.
Maths Fun - Diet Coke and Mentos Eruptions
Warning - This experiment must be done outdoors!
Aim
To investigate if Diet Coke at different temperature reacts differently with Mentos
Requirements
- 5 bottles of Diet Coke (at different temperatures)
- 1 packet of Mentos mints
- 5 thermometers
- You and 5 friends
- An outdoors area
Instructions
- Before you start, find an outdoor area with a wall behind it. With removable chalk, mark the wall with 10 cm markings. This will help you to measure the heights of the eruptions.
- Label the bottles A, B, C, D and E.
- Place all 5 bottles of Diet Coke in the refrigerator at the same time. Leave them to chill for at least 3 hours.
- After 15 minutes, remove Bottle A from the refrigerator.
- After another 15 minutes, remove Bottle B from the refrigerator.
- Repeat this until all bottles have been removed. There will now be 5 bottles at 5 different temperatures. Quickly measure and record the temperatures.
- Now, take all 5 bottles and the Mentos outdoors.
- At the same time, each of the 5 people drops one Mentos into the Diet Coke. While this occurs, another person takes a photograph of all 5 eruptions.
- From the photograph, estimate the heights of the eruptions and record this in a table.
- Draw a scatterplot with Temperature on the x-axis and Height on the y-axis.
- What do you notice? Why do you think this happens? (Hint: Different quantities of carbon dioxide gas dissolve in water at different temperatures.)
Question - Scatterplot of Effectiveness of Bombs
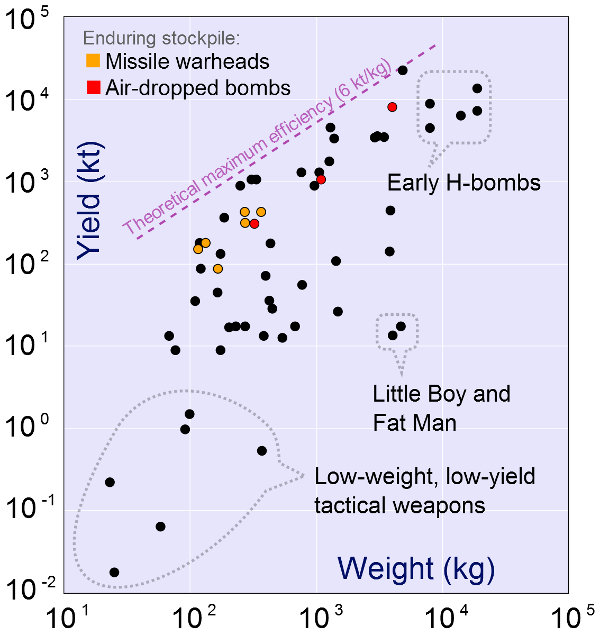
This scatterplot (using a logarithmic scale) is about the effectiveness of bombs. The x-axis shows the Bomb Mass (in kilograms). The y-axis shows the Destructive Yield (in kilotonnes of earth moved). In this scatterplot, the purple line is not a line of best fit, but instead shows the Maximum Effectiveness which is 6 kilotonnes of destructive yield for every kilogram of bomb mass.
The rule is:
| Bomb Effectiveness = | Yield |
| Mass |
By first estimating the Yield and the Mass, work out the approximate destructiveness of the "Little Boy" and the "Fat Man" atomic bombs dropped on Japan in 1945.
Answer
Approximately 4.5 kt/kg or 4 500 000 times more destructive than its mass

| 
| 
|