Standard Deviation
The Variance and the Standard Deviation are measures of spread of the data indicating how far the data is away from the normal (mean).
When data such as people's heights, weights, intelligence, school test marks and so forth are graphed, they tend to create a "bell-shaped curve" or normal distribution curve.
Mathematical Symbols:
- Mean μ
- Variance σ 2
- Standard Deviation σ
Normal Distribution Graph:
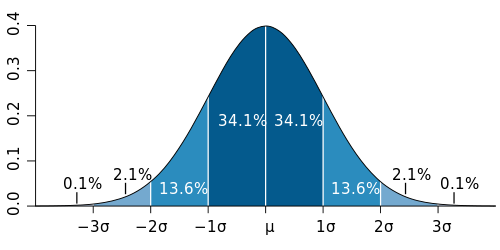
A Normal Distribution curve with sufficient data has the following features:
- The Mean is in the middle.
- The Highest Score is the Mean plus 3 Standard Deviations.
- The Lowest Score is the Mean minus 3 Standard Deviations.
Finding the Standard Deviation of a Population
- Calculate the Mean of all the data (by adding up all the numbers and dividing by how many numbers there are).
- For each data number, subtract it from the Mean.
- Square this difference. This is called the Squared Difference.
- Find the Mean of the Squared Differences. This is called the Variance.
- Find the Square Root of the Variance. This is called the Standard Deviation.
Example One - Intelligence Quotient (IQ)
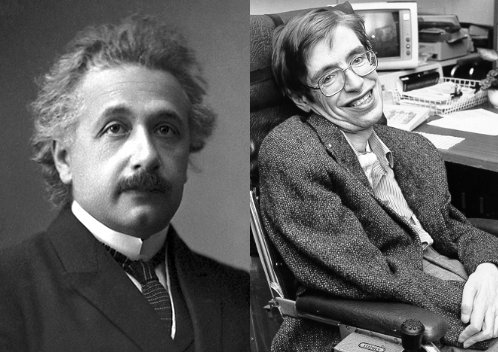
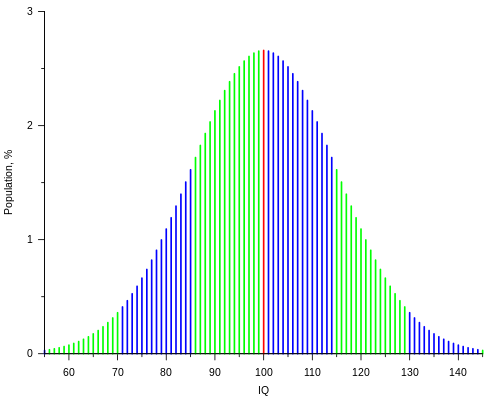
In most IQ tests, the "average" or Mean IQ is about 100 and the Standard Deviation is about 15. The vast majority of people have IQs between 70 and 130. However, famous physicists Albert Einstein and Stephen Hawking (in the photographs above) are thought to have IQs of about 145 (which is equal to the Mean plus 3 Standard Deviations). Refer to the instructions above to calculate the mean, the variance and the standard deviation of the IQ data of the following fictitious people listed in this table.
| PERSON | IQ |
| Al | 76 |
| Bert | 80 |
| Cuc | 89 |
| David | 96 |
| Eng | 100 |
| Fran | 102 |
| Gianni | 106 |
| Helena | 108 |
| Ines | 122 |
| Jack | 130 |
Answer:
| PERSON | IQ | IQ DIFFERENCE FROM THE MEAN | SQUARE OF THE IQ DIFFERENCE FROM THE MEAN |
| Al | 76 | – 24.9 | 620.01 |
| Bert | 80 | – 20.9 | 436.81 |
| Cuc | 89 | – 11.9 | 141.61 |
| David | 96 | – 4.9 | 24.01 |
| Eng | 100 | – 0.9 | 0.81 |
| Fran | 102 | + 1.1 | 1.21 |
| Gianni | 106 | + 5.1 | 26.01 |
| Helena | 108 | + 7.1 | 50.41 |
| Ines | 122 | + 21.1 | 445.21 |
| Jack | 130 | + 29.1 | 846.81 |
| MEAN IQ = 100.9 | MEAN OF SQUARED DIFFERENCES = 259.29 |
Mean = 100.9
Variance = 259.29
| Standard Deviation | = square root of variance |
| = √ 259.29 = 16.1 |
Example Two - World's Tallest Structures
| STRUCTURE | HEIGHT IN METRES |
| Great Pyramid of Giza | 139 |
| Eiffel Tower | 300 |
| Empire State | 381 |
| Petronas Towers | 452 |
| Taipei 101 | 509 |
| World Trade Centre | 526 |
| CN Tower | 553 |
| KVLY-TV Mast | 629 |
| Warsaw Radio Mast | 646 |
| Burj Khalifa | 830 |

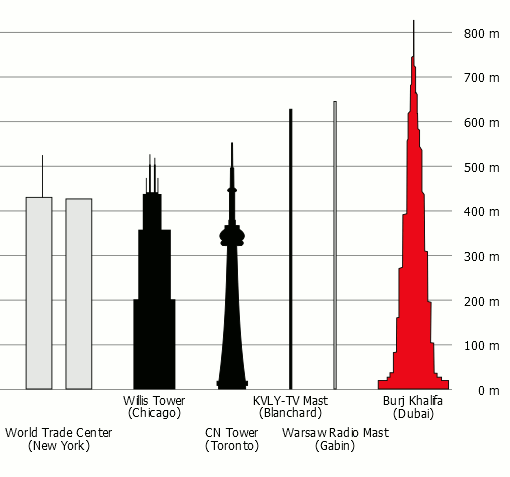
The graph and the table show the heights of ten of the world's tallest structures. Draw a table and then calculate the:
(a) mean
(b) variance
(c) standard deviation.
Answer:
| STRUCTURE | HEIGHT IN METRES | HEIGHT DIFFERENCE FROM THE MEAN | SQUARE OF THE HEIGHT DIFFERENCE FROM THE MEAN |
| Great Pyramid of Giza | 139 | – 357.5 | 127 806.25 |
| Eiffel Tower | 300 | – 196.5 | 38 612.25 |
| Empire State | 381 | – 115.5 | 13 340.25 |
| Petronas Towers | 452 | – 44.5 | 1 980.25 |
| Taipei 101 | 509 | + 12.5 | 156.25 |
| World Trade Centre | 526 | + 29.5 | 870.25 |
| CN Tower | 553 | + 56.5 | 3 192.25 |
| KVLY-TV Mast | 629 | + 132.5 | 17 556.25 |
| Warsaw Radio Mast | 646 | + 149.5 | 22 350.25 |
| Burj Khalifa | 830 | + 333.5 | 111 222.25 |
| MEAN HEIGHT = 496.5 m | MEAN OF SQUARED DIFFERENCES = 22 597.525 |
Mean = 496.5 m
Variance = 22 597.525
| Standard Deviation | = square root of variance |
| = √ 22 597.525 = 150.32 m |
Questions to Consider
Which building is closest to the "average" height of these ten structures?
Why are some of the differences from the mean positive and others negative?
Why are these differences squared?
Maths Fun
Find out how to get the Mean and the Standard Deviation on your calculator without using a table. The symbols are:
- Mean x
- Standard Deviation σn-1

| 
| 
|